Upshot: Violent crime on O‘ahu was generally lower than in prior years.
The Hawai‘i Crime Lab is in full swing now and thanks to one of our excellent research assistants, Emma Burnkrant, we now have the counts of the four major violent crime types on O‘ahu for the last three years.
The graphs below illustrate the rate for each crime type per month between January 2022 and December 2024 collected from the HPD dashboard. (As noted in our prior posts, for data we’ve already collected, we use the numbers we collected at the time, but keeping in mind that the numbers get updated on the HPD dashboard as new information comes in. To avoid having to recollect the data for each analysis as the numbers change, we only collect the data once, freezing the counts where they were when we collected them.)


Let’s take these one at a time.
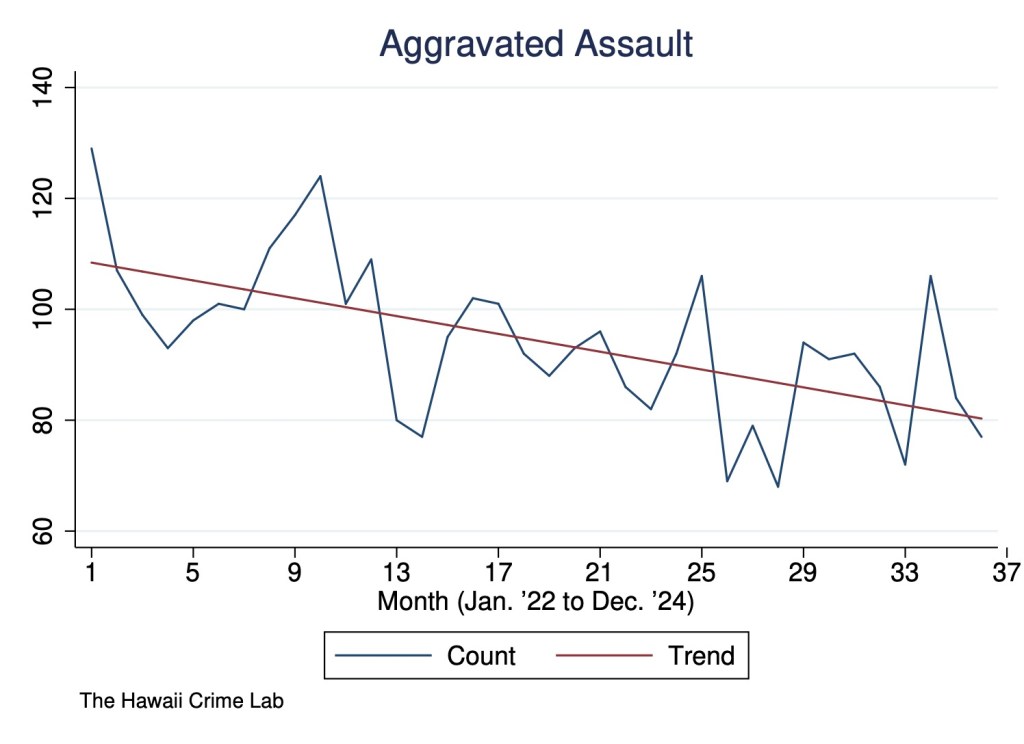
Aggravated assault in 2024 was lower than in prior years. We can see that the thin green solid line is generally lower than the thick orange line (representing the average for all three years) and often lower than the dashed and dotted lines representing 2023 and 2022, respectively.
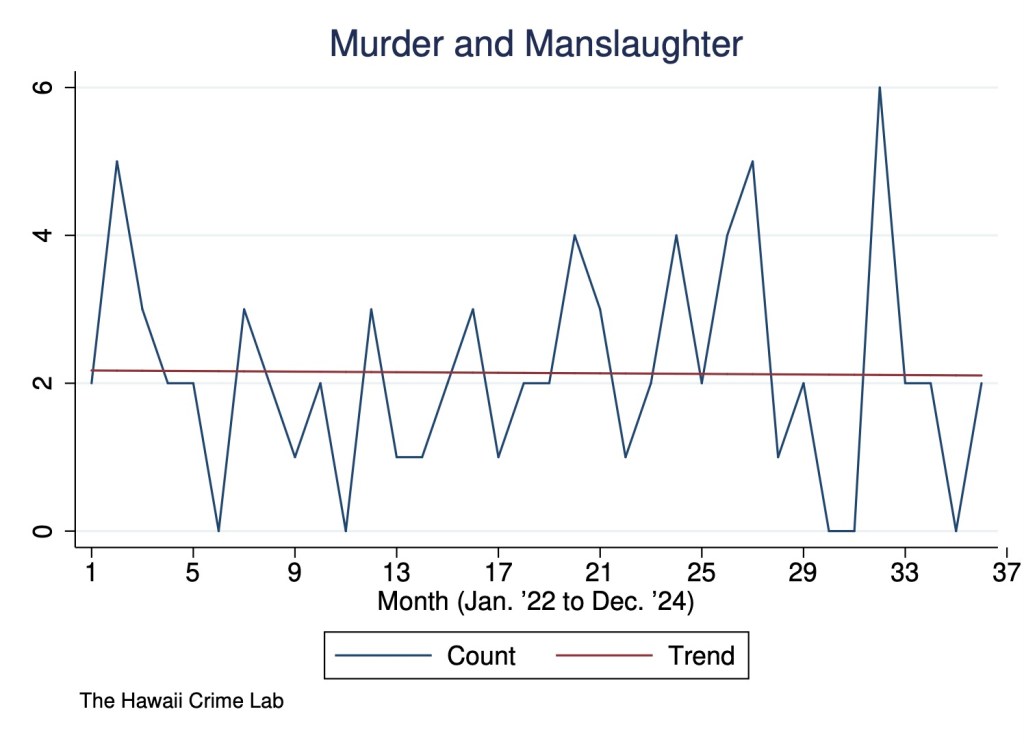
The number of homicides (murders and manslaughters) fluctuates but is roughly constant. In 2024, we had some months where the number of homicides was higher than the average (especially February, March, and August), others were it was lower (especially June and July), and other months where the numbers were pretty similar to the average.
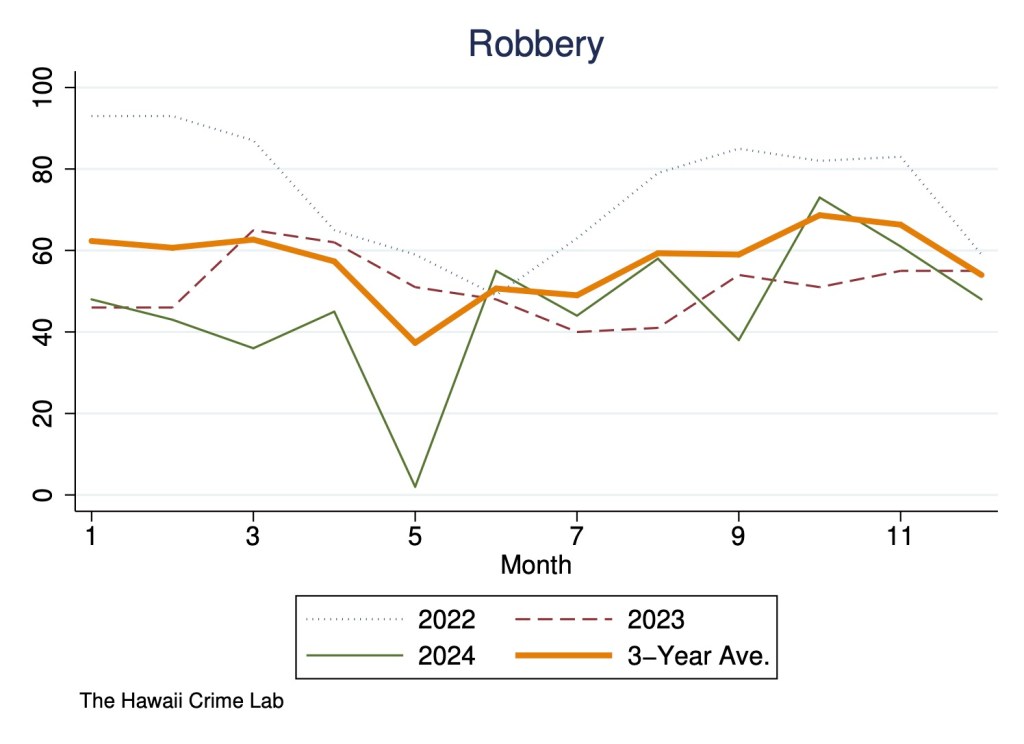
The number of robberies was generally lower in 2024 than in prior years. From January to May, the number of robberies was quite a bit lower than average. From June to December, the number of robberies tended to track the average (but was slightly higher than average) and generally higher than the same months in 2023 (except for September).
The number of sex offenses also varied throughout the year, but it either tracked the average pretty closely and when it didn’t, the count was lower than average (as in April, May, and October). Likewise, there were some months when the number of sex offenses were higher than in 2023 (February, June, August, and December), and months were the numbers were similar or the months in 2023 were higher (such as May and October).
Okay, but are any of these differences significant? That is, are they just part of the expected variation or are they something we can think of as “real” or meaningful differences.
We now have enough data that we can run some fairly simple regressions to calculate the significance associated with differences between years.
The results suggest that the number of aggravated assaults in 2024 were significantly lower than the count in 2022, but not quite low enough to be significantly lower than 2023.
The number of homicides are statistically indistinguishable across the three years (there were the same number of homicides in 2024 as 2023, which was slightly more than in 2022).
The number of robberies in 2024 were significantly lower than in 2022, but like aggravated assaults, not so much lower as to be significantly lower than in 2023.
Sexual offenses in 2024 were also not statistically distinguishable from the prior two years (there were fewer on average from 2022 but slightly more than in 2023).
As a final analysis, I wanted to see what violent crime trends look like over the long term. So in the following series of plots, I show the monthly counts for each crime type from January 2022 to December 2024. I also superimpose a “trend line,” which is the prediction generated from a simple regression of crime counts on time. The declining trends for aggravated assault and robbery are highly significant; the flat line for murder is not significant; and the declining trend line for sex offenses is just barely not significant.


As we’ve discussed before, there may be geographical differences across O‘ahu such that violent crime could be up in some areas even if it’s down overall. We will be investigating this further, but for now, this post gives us a bird’s eye view of violent crime on O‘ahu for the past three years. Stay tuned!
