In this post, we zoom in to the Windward and Leeward sides of the island to look at violent crime between 2022 and 2024.
For this analysis, we were curious about a few things: 1) Is crime on the West side so much higher than other roughly comparable parts of the island, as it seems from news coverage? 2) How did the crime counts for 2024 look, compared to prior years, when we focus on specific regions instead of looking at all of O‘ahu, as we did in our previous post? And 3) can we see whether the additional police sent to the West side between mid-August and December contributed to a decline in violence?
The data analyzed in this blog post were collected by Emma Burnkrant and Jesus Romero.
Crime Counts on the Windward v. Leeward Sides
Comparing crime rates between places is always a risky endeavor because no two places are truly comparable. For example, when scholars wanted to estimate the impact on California’s three strikes law on that state’s crime rate, there is not usually a good comparison state. (Truly, what state is comparable to California, or Texas, or Hawai‘i?) Instead, for situations like that, scholars often use a technique called “synthetic controls” where they make a fictional Frankenstein-like state (made up of combined data from other states) to serve as the control case. I’m not going to do anything as sophisticated as that, even though that’s a really cool technique. Instead, I’m going to try to compare the Windward and Leeward sides of O‘ahu, also known as District 4 and District 8.
Why these two districts? The two opposite sides of the islands have a similar mix of rural, suburban, and small urban areas and they are comparably sized. I found an estimate from 2010 of the population of District 4 (Windward) that says the population is about 132,266 people; another one from 2022 says District 8 (Leeward or the West side) is about 127,263 people. The populations won’t be exact now, but these are close enough that the counts should be roughly comparable. There is an important caveat though, which is the Windward side is home to a large Mormon population. Why does this matter? Mormons tend to commit less crime than others, so this could contribute to differences in the crime rate. On the other hand, Mormons tend to live on the Northern part of District 4, which is more sparsely populated than the small cities of Kaneohe and Kailua, which would be the majority of the district’s population, so the contribution should not be huge. But it’s important to always remember that the comparisons won’t be perfect.
So, with those caveats in mind, what do we find?
Across the board, crime is definitely higher on the West side than on the Windward side.
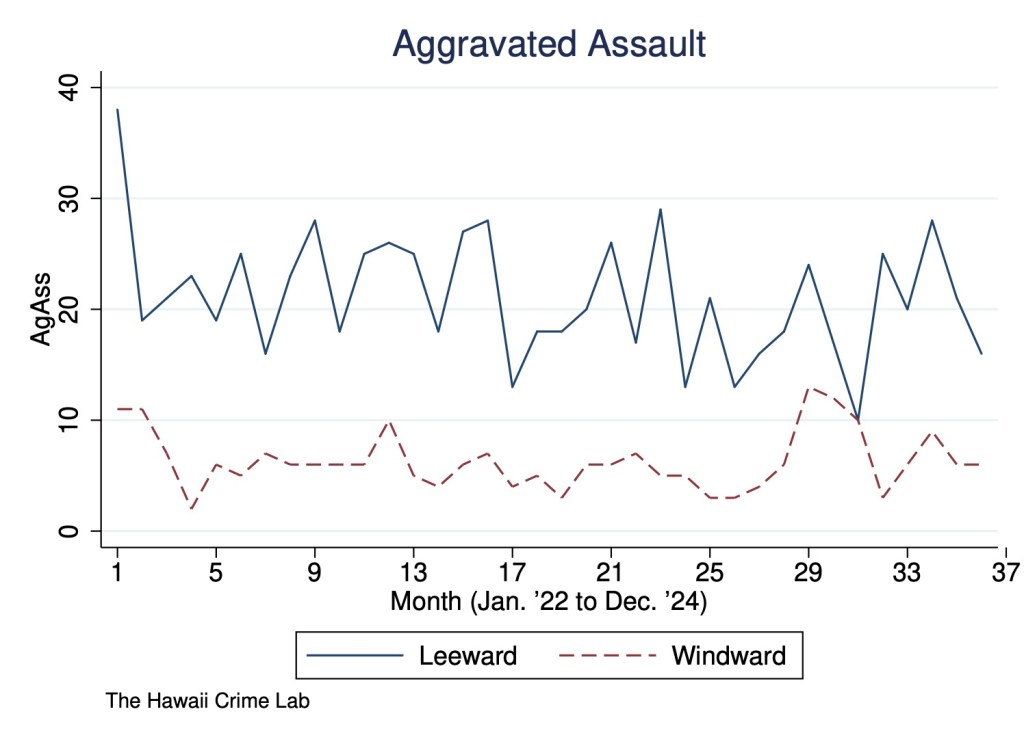
Let’s start with aggravated assault. In 2023, there were (on average) 15.75 more aggravated assaults each month on the Leeward side than on the Windward, and this difference is significant. The following year, the difference was 12.33 and also significant.
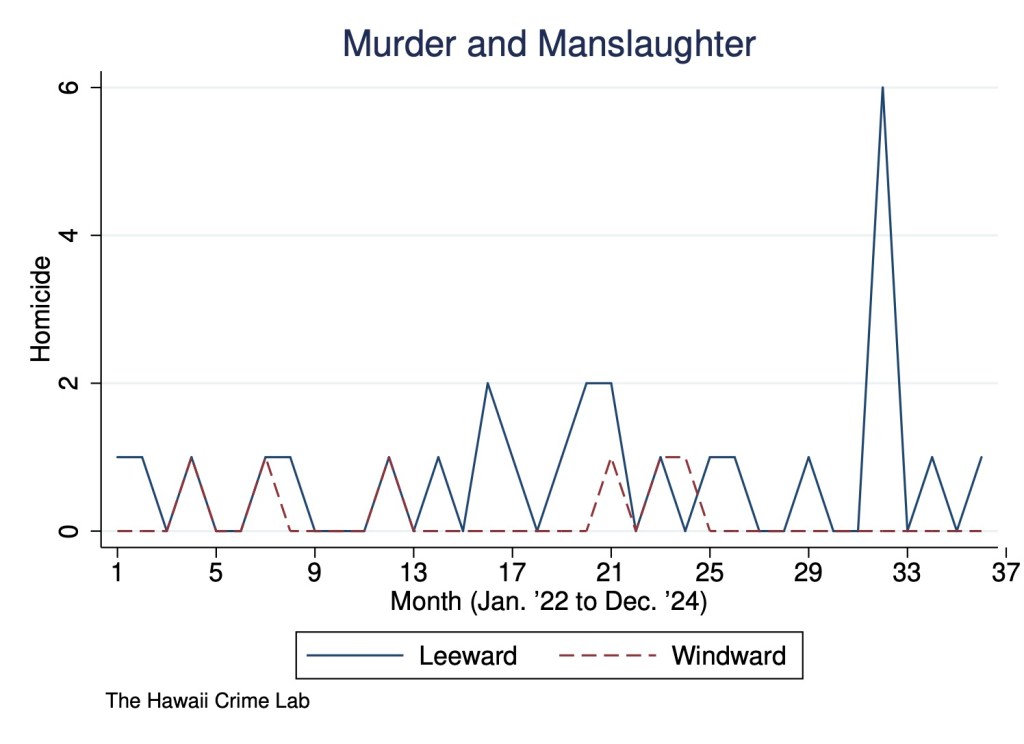
What about homicide? There were (on average) .58 more homicides a month on the Leeward side and this difference is lightly significant. The following year, the difference jumped to .92, but it was just barely no longer significant.
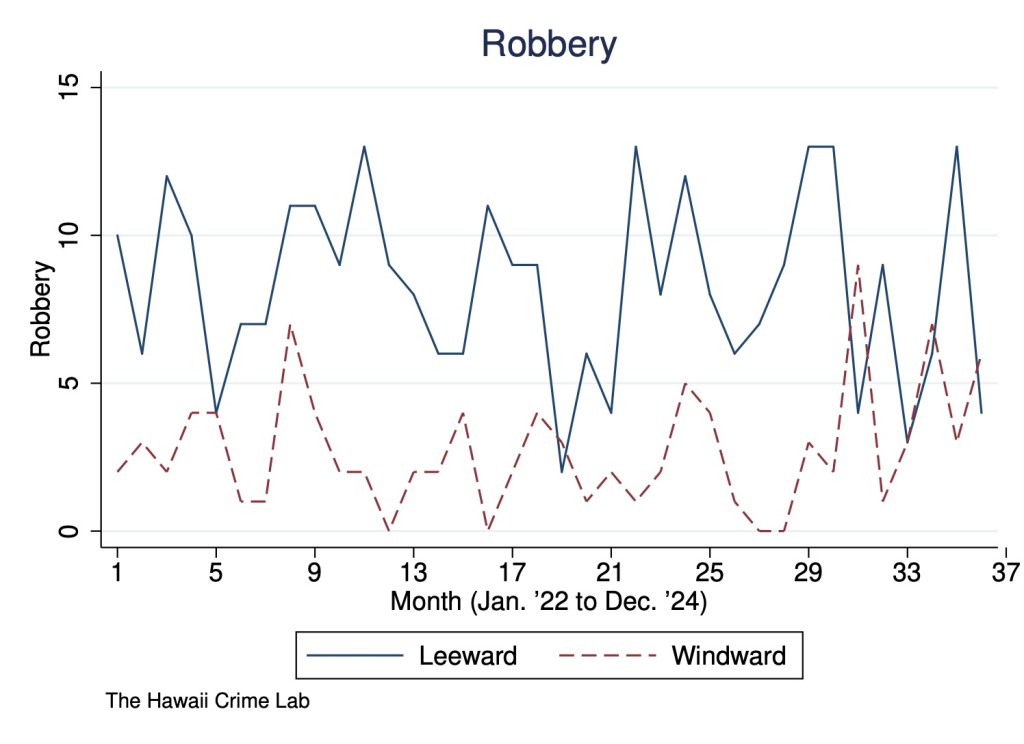
Robberies in 2023 were (on average) 5.5 higher on the Leeward side and this number was significant. Similarly, in 2024, they were 4.67 higher, also significant.
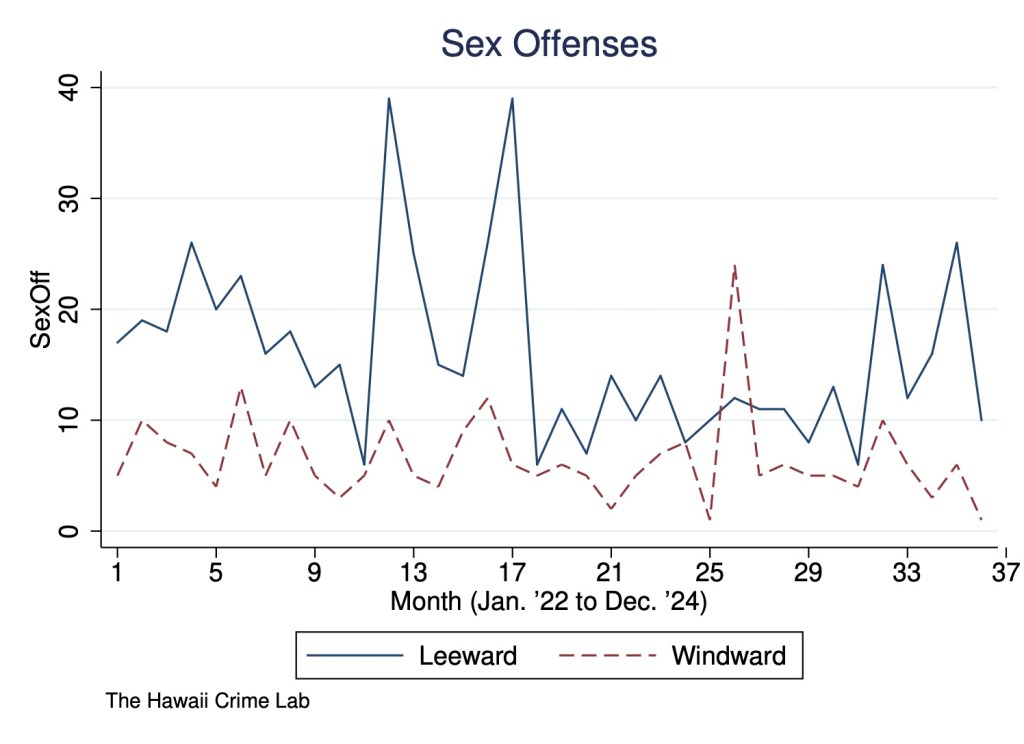
Sex offenses were also higher by an average of 9.58 a month in 2023, also significant, and by 6.92 a month in 2024, also significant.
So there is a pretty clear difference across the board favoring the Windward side.
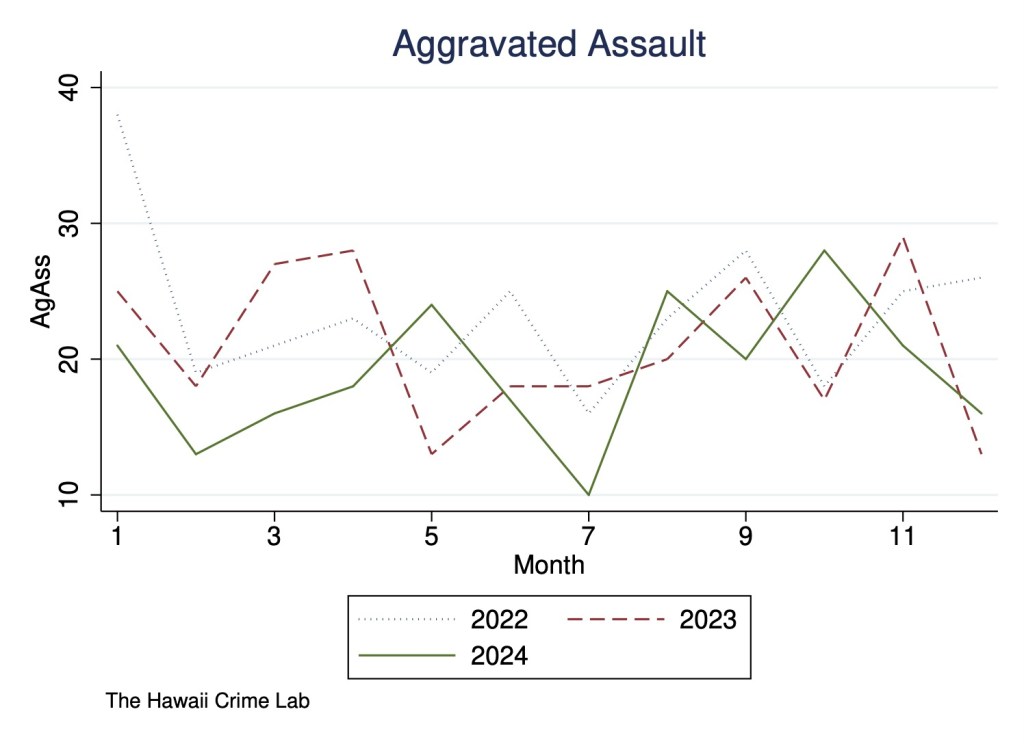
We can also see this visually depicted in the following graphs displaying the monthly counts of the four reported types of violent crime in each district.
Crime Counts in 2024 Relative to Prior Years
In our previous post, we saw that crime was generally down on O‘ahu relative to earlier years. But we also cautioned that there could be regional variation hidden by the aggregated trends. So what happens when we look at the data within these two specific districts? Again, for this analysis I’m using regression analyses to assess year-based differences.
Let’s take it one district at a time, one crime type at a time.
District 8: Leeward Side
Aggravated assaults in 2024 were lower than it was in 2022, but just barely not significantly so. Although the 2024 numbers were also lower than in 2023, there were statistically indistinguishable.
Homicides were slightly higher in 2024 than in both 2022 and 2023, but they were statistically indistinguishable from both years.
Robberies in 2024 were slightly lower than in 2022, but statistically indistinguishable, and about the same as they were in 2023.
Sex offenses in 2024 were slightly lower than in 2022 and just barely not statistically significant. They were were also slightly lower than in 2023, but statistically indistinguishable.
In conclusion, most of the comparisons are simply not significant enough to speak to a meaningful difference over time, even though in most cases we see modest declines over time.
District 4: Windward Side
Aggravated assaults in 2024 were very slightly lower than in 2022, but statistically indistinguishable from those numbers. They were also actually higher than in 2023, but not significantly so.
Homicides were very slightly lower in 2024 than in 2022 and 2023, and in both cases they were just slightly not significantly so.
Robberies in 2024 were slightly higher than in 2022 and 2023, but in both cases statistically indistinguishable from prior years.
Sex offenses in 2024 were slightly lower than in 2022, but statistically indistinguishable from those numbers. They were very slightly higher than in 2023, but statistically indistinguishable.
In conclusion, again most comparisons were not statistically significant although we do see a greater mix of ups and downs over time than on the Leeward side.
Can We See Evidence of Police-Led Crime Reductions on the West Side?
One major question we had was did the extra policing on the West Side make a difference on the violent crime rate? There are reasons to imagine it could and it couldn’t. There are some types of crimes that are very difficult to prevent. For example, there are some cases of murder that are simply not going to be deterred or dissuaded; in those cases, your best hope is for a swift response from law enforcement. There are other types of crime where the police presence can be very helpful in dissuading would-be criminals from proceeding with their plans. Additionally, police work has downstream consequences, such as getting guns out of circulation or arresting people for other offenses before they have the opportunity to commit bigger offenses. The question of whether to withdraw police resources from the West Side has also been in the news. It is something we discussed in our crime lab and something we are interested in seeing if we can weigh in on.
To answer this question, we ran a differences-in-differences analysis, which is a statistical technique that compares, in this case, the difference between the Leeward crime counts before and after the influx of police in mid-August 2024 and the difference between the Windward crime counts in the same time windows. This allows us to “hold constant” secular fluctuations that might affect the whole island or at least a comparable district of the island and compare the pre/post periods of the intervention. Since we are limited to monthly data, we are treating September-December 2024 as the intervention period.
One very important caveat is that other changes were likely occurring on the West Side during this time as community members and government officials were trying multiple strategies to reduce crime. We cannot say from our analysis how much of any change is from direct policing, other law enforcement strategies (like the ice cream social the HPD hosted), or community-led efforts. Instead, any changes should be seen as a collective result of any such changes.
There are some other important caveats we need to take into account any time we are trying to explain the crime rate. One that I want to highlight is “reversion to the mean”: crime control interventions are often introduced after crime rates become exceptionally high, or are perceived to be exceptionally high. In many cases, exceptionally high crime rates are almost naturally followed by a return to normal levels. It is easy to mistake a downturn in crime following an intervention introduced under such circumstances as evidence of success. In this case, August was a particularly bad month for the West side with a large number of homicides. Sex offenses on the West side were also higher at that time. However, robberies and aggravated assaults were not particularly high right before the intervention. To some extent, the perception of crisis, spurred on by the high number of homicides in one month, may have been played a larger role. So while we should expect reversion to the mean in the case of homicide, it should not be present with the other cases. Additionally, we’re including the data from 2022 and 2023, which can help avoid some of these challenges. I display the Leeward data below for visual inspection.


For anyone interested in the technical details, we are running two kinds of regressions. One is a basic regression controlling for the district (a binary variable), the period of intervention (a binary variable), and an interaction term of district*intervention (another binary variable). The other controls for those same variables as well as “fixed effects” for months and years in case there are monthly or yearly trends.
We will again take this for each crime type, keeping in mind that police presence can have different impacts on different types of crime.
We see no significant change to the counts of aggravated assault in either analysis. In our basic regression, the treatment period is associated with an increase of .1 aggravated assaults (but this is not statistically significant) and an increase of .8 aggravated ssaults in our fixed effects regression (again, not significant).
We see no significant change to the counts of homicide in either analysis. In our basic regression, the treatment period is associated with a decrease of .28 homicides (but this is not statistically significant) and a decrease of .42 homicides in our fixed effects regression (again, not significant).
We do see a 2.0 decrease in robberies in our basic regression and this is on the border between significance and not significant. Similarly, we see a 2.94 decrease in robberies in our fixed effects regression, but this also is not clearly significant.
We see an increase in sex offenses by .06 in our basic regression, but this is not significant. We see a 4.39-count increase in our fixed effects model, but this is also not significant.
In conclusion, we do not see strong evidence that the additional police (and related strategies) had an impact on the crime rate. It is possible that the policing strategies were responsible for a decline in robberies, but we do not see an across-the-board change. However, to the extent that robberies tend to be more planned crimes, this finding may make sense.
Next steps: We could make a more robust analysis if we can also compare what happens after the police withdraw (do we see a change in the crime rate?). We could also add in other districts to our analysis, which might help in case other districts have more similar secular trends to the West Side than the Windward Side. Before drawing any conclusions from our analysis comparing the Leeward and Windward sides, comparing the Leeward side to other comparable districts and seeing if similar patterns hold up would be advisable. Finally, we could also look at the changes in property crimes. Stay tuned!
