A recurring question for people—residents, voters, politicians, practitioners, scholars—is where is the crime rate relative to where it usually is or where it used to be?
At the Crime Lab, we often use the data from the HPD dashboard, but in this post, we’re going to look at some other data sources that give us a longer-view than just the last five years. In particular, the pandemic did big things to the crime rate—in many places, the lockdown reduced crime, whereas coming out of lockdown saw a spike. Commentators and politicians have been especially interested in what crime has done since then—is it higher or lower than it was before the pandemic?
Well, we want to ask these questions for Hawai‘i. To do that, we’re looking at two datasets that are publicly available. Each will have some limitations, but combining them should help address some of those limitations.
Hawai‘i’s state government maintains several datasets containing crime counts, which they link on their website here. One downside of a lot of our publicly available data is it is not as recent as we would like. In one case, we have data between 2018 and 2023; in another case, we have data from 1975 to 2021. So we can’t see where 2024 was (or 2025 is) in relation to those prior years, which would help us figure out where we are now.
The first dataset is the NIBRS database. Hawai‘i’s NIBRS dashboard is available here. NIBRS stands for the National Incident-Based Reporting System.
The key feature of NIBRS is they pay attention to incidents versus specific offenses. For example, last August, when Hiram Silva killed three women at his neighbor’s house, and then the neighbor shot and killed him in self-defense, there were four homicides, but one incident. When tracking crime counts, it can be tricky to figure out if crime spiked in a given month in the sense we usually think about—a lot of different somewhat independent incidents—or if there was a major episode that included multiple victims and multiple crimes, and thus shows up in our data as a lot of crimes.
So what do the data tell us? The first of the following two graphs (created by the NIBRS dashboard) shows the crime data submitted by the HPD. (If we don’t limit it to the HPD, we mix different years and come up with very different but misleading trends!) We can see the decline in crime overall in early 2020 as lockdown orders went into effect and we stayed hunkered down, then crime rates went back to normal. Over time, however, starting in early 2022, crime overall started to come down substantially. In the second graph, which shows the crime counts broken up by person, property, or society offenses, we can see how these trends vary by crime type. In the top (orange) line, we see a pretty significant decline in property offenses in early and mid-2020, the return to normal in 2021, and then the decline over 2022 and 2023. At the Hawai‘i Crime Lab, we’ve mostly been interested in violent crime, in part because that gets so much attention on the news. There, it’s a bit hard to see the trend from the graph in part because the scale is more appropriate for the property crimes. Overall, the rate looks pretty flat, but with a rise in roughly the second quarter of 2021 lasting for a while, coming down slightly, then back up in mid-2022, but then with a consistently lower count in 2023. This is generally consistent with the trends we noted in a prior post in which we saw that the violent crime counts were generally (if not always significantly) lower in 2023 than in 2022 (and then continued to lower in 2024, which we don’t have data on here).

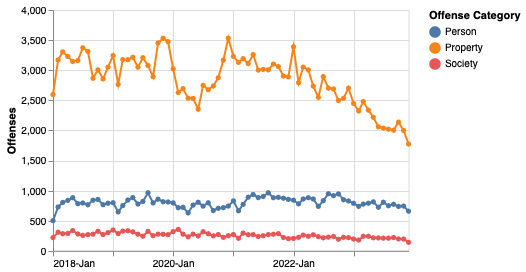
What about on a longer time scale?
To see the longer trends, we look to Hawai‘i’s UCR data, which is available here. UCR stands for the Uniform Crime Reports, which is another federal collection of crime data. This dataset is based on reports of crime to law enforcement. (NIBRS was added to split up the incidents versus offenses, but UCR looks at discrete offenses.)
In this post, we’re just going to look at the murder rate. In future posts, we can look at the other UCR crime categories (Rape, Robbery, Aggravated Assault) as well as property offenses.
The two graphs below show the same data, but one going back to 1975 and the other truncated at 2001 so we can see the more recent trends better. Both graphs show the number of murders per year. In both cases, we see that adult murder came down in the 2000s and then started to increase in 2017. Notably, the adult counts from 2017 to 2021–the higher period–are pretty comparable to where they were in the late 1990s. But that’s a pretty sizeable increase after a decade and a half of lower counts. However, since the population on O‘ahu has continued to increase over time, the rate would be lower in this higher period than in the 1990s when the counts were more similar, but that doesn’t the pretty substantial increase in 2017.


Frustratingly, we don’t have the UCR data from after 2021 yet.
However, we do have the HPD dashboard, which offers us data from the last five years. This does not allow us an apples-to-apples comparison. HPD’s dashboard merges murders and manslaughters, whereas UCR just reports on murders. Additionally, there can be other small differences between datasets that are not always clear from the outside. But despite these issues, we can try to match up the data so we can get a sense of the trends.
For starters, let’s see if the data from overlapping years in both datasets are similar enough. The graph below shows the different counts for 2019-2021, the years in which we have data from both datasets. The graph shows the data don’t line up perfectly—as we expected, but they are pretty close (with a much bigger gap in 2019, but more similarity in 2020 and 2021). We’d also expect the HPD line to be higher (show more counts) than the UCR count because it also includes manslaughters, but it’s lower (shows fewer counts), which is surprising. But the two are close enough that they are within the margin of error (that is, the lines are not significantly different).

So with the datasets vetted somewhat (none of this will be perfect!), we can put them together and see the recent numbers in longer-term perspective.
The following graph shows the annual HPD murder and manslaughter counts from 2019 to 2024 along with the UCR annual counts of murder from 2001 to 2021. The result is somewhat intimidating: we see a pretty large spike starting after 2021.

This leads us in a different direction from prior posts when we saw that the homicide counts were statistically flat—that is, there were not significant differences between 2022, 2023, and 2024. Sure enough, looking at the counts for these years (25, 26, and 32), the numbers are not significantly different. We had previously not included 2020 and 2021 in our analyses because those years were the height of the pandemic and would create an artificial comparison. However, now we have the longer term perspective, we can that homicides had been relatively higher since 2017. It appears that 2020 and 2021 were relatively lower count years and in 2022, we basically went back to where the count was in 2019 and then kept climbing, back to our peak in 2017. So one question for the future will be whether these numbers are our “new normal” on O‘ahu or if the numbers start will coming back down. Since our monthly analyses were showing mostly a steady state or even a possible decline rather than a clear upward trend, we can hope the worst is behind us, but ultimately time will tell.
